
Comparative Forecasting of MTN Nigeria Stock Prices and Trading Volume using Box–Jenkins Models and a Reduced Factorial Design
DOI:
https://doi.org/10.33003/fjs-2026-1020-5741Keywords:
Box-Jenkins, MTN Nigeria, ARIMA, SARIMA, Rolling forecast, Factorial design, NGX, Stock price, Trading volumeAbstract
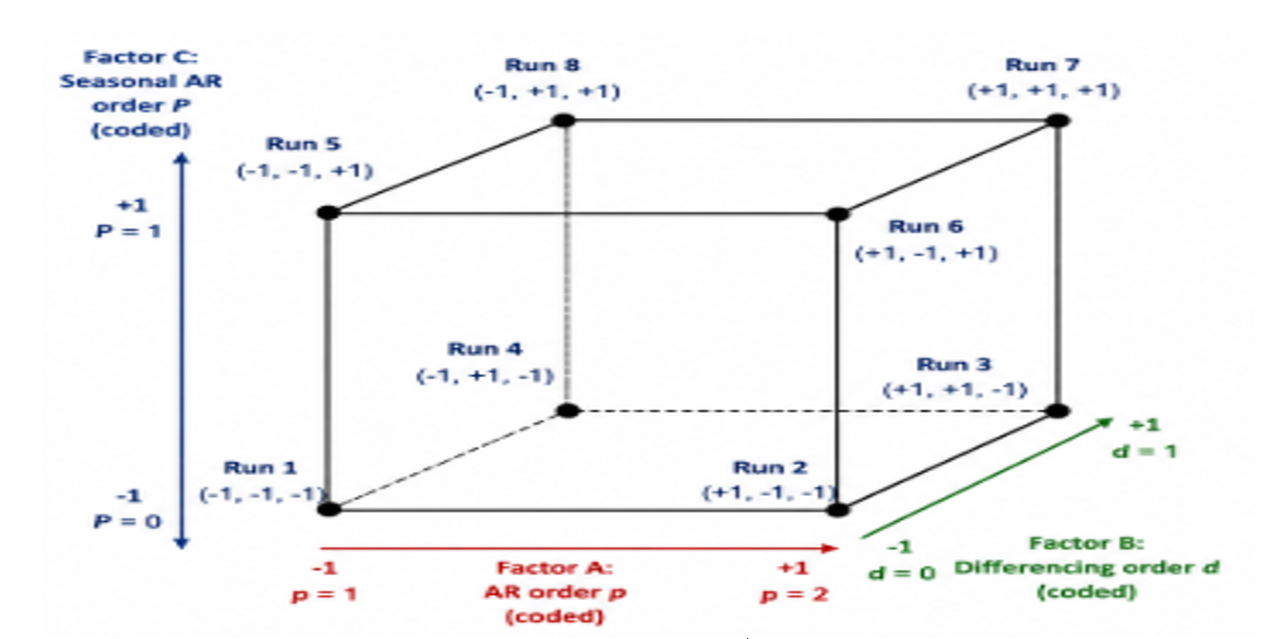
This study compares Box-Jenkins forecasting structures (ARMA(p,q), ARIMA(p,d,q), and SARIMA(p,d,q)(P,D,Q)s) for the daily closing stock price and trading volume of MTN Nigeria Communications Plc (MTNN) on the Nigerian Exchange Group (NGX), and decomposes the structural drivers of accuracy using a factorial design. Using 249 daily observations from 26 May 2025 to 26 May 2026, eight candidate configurations spanning AR order (p ∈ {1,2}), differencing order (d ∈ {0,1}) and seasonal AR order (P ∈ {0,1}) were evaluated for trading volume, forming a complete 2³ factorial design; for stock price, only six of the eight combinations were estimated – the two SARIMA specifications without differencing (d = 0, P = 1) were not fitted – so the price analysis is a reduced, non-orthogonal design, and its factorial effects are reported with that limitation stated explicitly. Models were estimated on a training sample of 227 observations and evaluated out-of-sample using rolling one-step-ahead forecasts across 22 validation observations. By RMSE, ARIMA(1,1,0) produced the most accurate stock price forecasts (RMSE = 24.21 NGN; MAPE = 1.71%), although ARMA(1,0) and ARMA(2,0) achieved lower MAE and MAPE; SARIMA(2,1,0)(1,0,0)₅ produced the most accurate trading-volume forecasts on all four criteria (RMSE = 3,177,444; MAPE = 44.69%). No single model was superior across both series or across all criteria: for price, first-order differencing was the dominant structural factor; for volume, AR order and the interaction between differencing and seasonal AR order were the dominant factors.
References
Acheampong, P., & Wiafe, E. A. (2019). Forecasting stock returns volatility of firms in the Ghana Stock Exchange: A comparison of ARMA, ARIMA and GARCH models. Journal of Finance and Economics, 7(1), 34–44.
Acquah-Sam, E. (2022). Time series analysis of West African stock markets. Journal of African Business, 23(2), 45–61.
Box, G. E. P., & Draper, N. R. (2007). Response surfaces, mixtures, and ridge analyses (2nd ed.). Wiley.
Box, G. E. P., Jenkins, G. M., Reinsel, G. C., & Ljung, G. M. (2015). Time series analysis: Forecasting and control (5th ed.). Wiley.
Deb, S. (2019). ARIMA forecasting of several major economies during the difficult period. Journal of Applied Statistics, 46(5), 830–845.
Fahriya, N., Suparti, S., & Tarno, T. (2021). Comparison of ARIMA and SARIMA models in forecasting the number of online motorcycle taxis. Media Statistika, 14(1), 71–81.
Hansun, S., Wicaksana, A., & Christy, V. (2022). Revisiting ARIMA in stock market forecasting: A systematic literature review. Investment Management and Financial Innovations, 19(3), 228–241.
Mondal, P., Shit, L., & Goswami, S. (2019). Study of effectiveness of time series modeling (ARIMA) in forecasting stock prices. International Journal of Computer Science, Engineering and Applications, 4(2), 13–29.
Montgomery, D. C. (2017). Design and analysis of experiments (9th ed.). Wiley.
Montgomery, D. C., Jennings, C. L., & Kulahci, M. (2015). Introduction to time series analysis and forecasting (2nd ed.). Wiley.
Tweneboah, G., Owusu Junior, P., & Oseifuah, E. K. (2019). Integration of major African stock markets: Evidence from multi-scale wavelets decomposition approach. Global Journal of Finance and Economics, 16(1), 1–20.
Downloads
Published
Issue
Section
Categories
License
Copyright (c) 2026 Odior Kenejime Anthony, Emudiaga Rukevwe Ericson

This work is licensed under a Creative Commons Attribution 4.0 International License.